Analyzing MLB free agent signings during this past off-season. This market is a bit inscrutable
Today I’m taking a look at off-season Free Agent activity, this time of the position player variety. I’ve included V Guerrero’s recent extension. This market is a bit harder to assess than the Starting Pitcher market, which I looked at early in the winter <here>. This is somewhat because there are fewer position players signing measurable contracts, forcing us to deal with even smaller sample sizes than the pitcher market holds. Also, gentlemen by the names of Ohtani and Soto represent unicorns within this small market, as well. They have signed somewhat exotic contracts that are either unique given their talents, or signal of trends to come. Let’s look and see what can be parsed out. There is some interesting stuff uncovered, at least interesting to me.
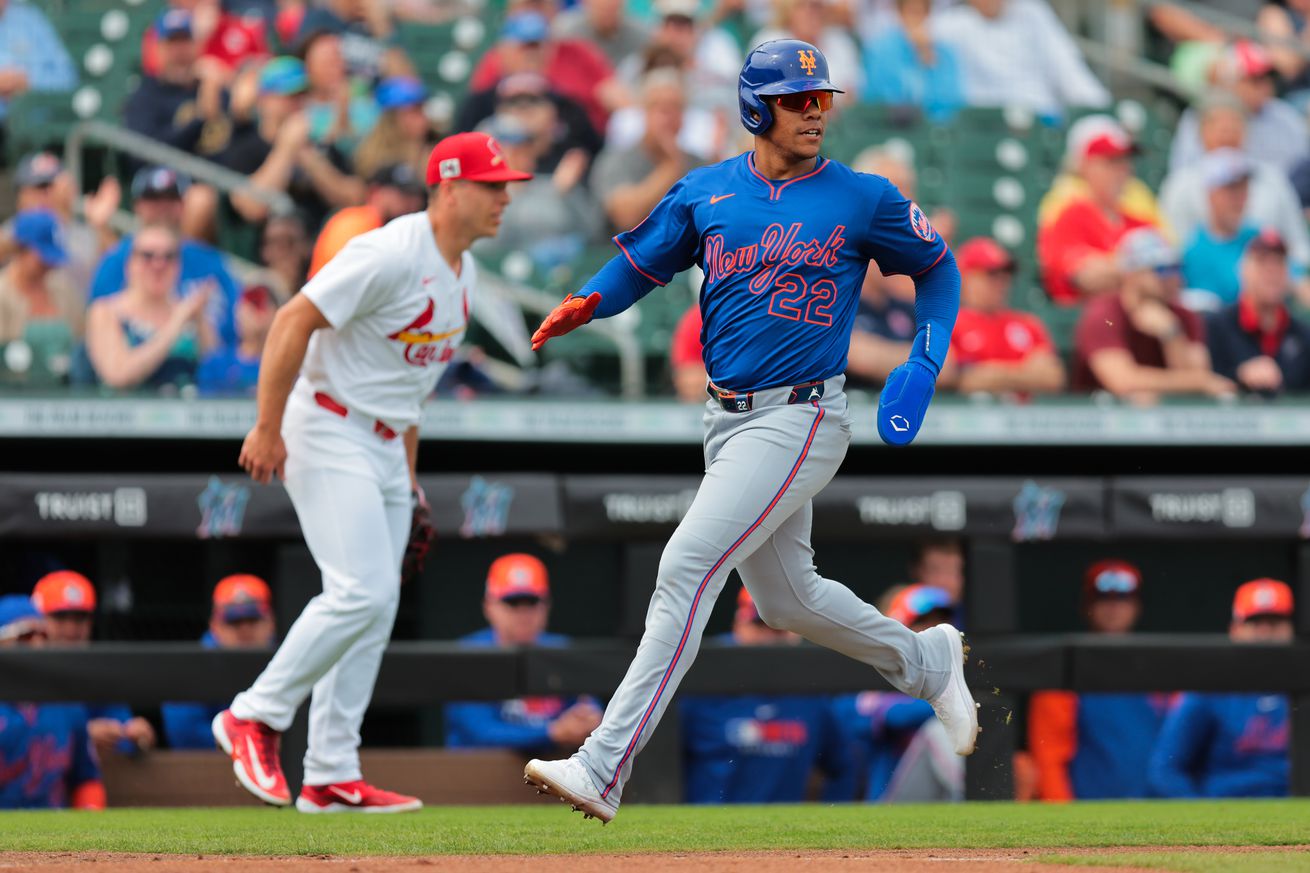
I included Ohtani (from last off-season) in the analysis to provide some ballast against Soto’s contract
The narratives
Much like the pitching market analysis, I wondered if the narrative of a WAR being worth $8m would hold up in this market? It really didn’t on the pitching side. I’ll look at that as best I can.
I also wondered if the narrative that peak production happens around 26-27 and decline accelerates at around 30? On the pitching side, the peak is indeed around age 26, but decline is very slow until after age 35 or 36, making higher dollar, longer term investments in older pitchers look more rational than one might have expected. But how about for hitters?
Further, what about the narrative that WAR declines at about .5 WAR per year after peak years have passed? Pitcher declines, as noted, are very slow. Nothing near .5 per year. How does that play out with notable players?
Hitters average performance – peak and decline trends
Before we get to the cost side of the batter equation, let’s take a quick peak at performance, via average player WAR and aging curves for a moment. Learning a lesson from the pitcher market analysis, I started out with narrow queries. I took only notable players (>10 career fWAR) to formulate the average and decline curve. These are the players that formulate the FA pool, and that is what I want to analyze.
What do we see in the data? It appears that peak production for notable hitters occurs between ages 26 and 30 without significant decline (a decent range). The actual peak WAR (on average) is age 27 at 3.01, but really this peak is immaterially different than averages seen across ages 26-30, where the averages range from 2.91 to 3.01. Note that average WAR among good hitters doesn’t start declining until age 30. Fundamentally, if you have a batter that has established themselves at age 26, you have a pretty good idea what they will be for the next 3-4 seasons (barring injury, of course).
To explain this table a bit, I followed the same methods as for pitchers. Counting notable hitters, totaling their WAR and getting an average by age was easy.
I added a little embellishment. First, the Yr2YrChg column shows how each age cohort performed relative to same group 1 year earlier. As you see, the average decline each year through age 34 is a fair bit less that .5/year. But…this average is only for batters who played that year. So this column is polluted with something kindred likes to call “survivor bias”. In this case, the average WAR is for the players who continued playing.
What about the 10-20% that dropped out from prior year. This can be illustrated if you gander at age 34 and age 35 rows. In the ag 34 cohort, there were 272 players. The next year, that group was down to 214. In the Yr2YrChg column, it appears as if the group average WAR went up by .1. But this ignores the risk represented by the 58 players who did not play their age 35 season (mostly retired, a few hurt) – the non-survivors.
When you include the players that dropped out into the average, you see that the average declined .3 WAR, instead of increasing .1 WAR. To me, this could be viewed as a better representation what an average decline rate might look like, so I added the “Last Year” column. Take whichever column you think better represents a reasonable decline curve. When calculating contract values (below), I put my finger on the scale a bit and took the most pessimistic number for each age when calculating a free agents’ future projected WAR.
For those that prefer the picture, see the graph below. The black line is notable hitters. Red is everyone. Green is my embellishment – the real rate of change. Note that even at advanced ages, the notable players are higher WAR producers (on average) than the whole hitter group is at peak.
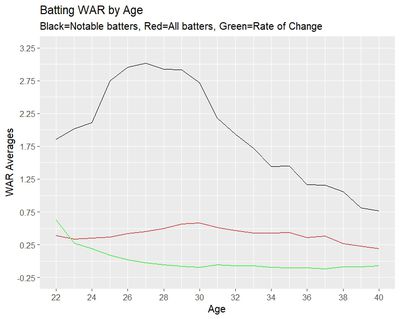
Data from Fangraphs.com
Note how flat the rate of change is between ages 28 and 38. Hardly falling off a cliff. I think I’m seeing why these hitters are getting the length of contract they are getting (mostly).
A side note, perhaps worthy of further investigation. Notable players peak around age 27. The set of ALL hitters peaks at age 30 (albeit at a much lower peak). I believe these are the late bloomers. They won’t maintain peak production long enough to attain notable status, but they still ascend throughout their late 20’s.
Something you can see in the data that is very different from the pitcher experience. Year-to-year, pitchers fall off (retire?) steadily at a rate between 10-20% year. Position players start to decline more rapidly than pitchers at 34. Between 33 and 34, only 13% of notable players move on (better than the whole population). That percentage rises to 27% after 34 and rises into the 40% bracket after 35. All in all, older pitchers are more reliable than older hitters, in terms of projectable future performance.
The way I’d summarize this is, if a player lasts, he will perform close to his benchmark during his 30’s, with slight decline rates. But his risk of not even playing by then is quite high – it’s worse than a 50-50 proposition. Much like pitchers, however, the prior year is a foreboding. A hitter older than 34 who performs below 1 WAR is probably done.
What does WAR cost?
Let’s move to the cost side of the equation. Now that the big players are off the market, we can look and see what it all means.
In this model, as with pitchers, I carried each hitter’s basic profile and projected their performance through the contract period based on the decline data from above. I applied the MLB approved discount rate to discount future payments back to net present value (NPV) so we can compare apples to apples.
**You will have to scroll right to see all the data.
Even with the sample size being small, I think there may be some tiers and commonalities here we can identify that help make sense of this hard-to-discern market.
First, as I look out at the right-most column ($ per projected WAR, in NPV terms), I can begin to see that the ~$8m per WAR doesn’t quite fit this market, as foreseen from the pitchers market and intuited by many commenters. Top tier players (Soto, Ohtani) sit at around $9.5m NPV per WAR expected. I suspect this non-linear figure applies to contracts that may exceed 6 WAR once or twice and an average of 4 WAR per year, roughly, over the contract life. Not enough data or history to tell if it is the expected WAR per year, or peak WAR or total WAR. Perhaps I seek a distinction where there is no real difference, but the strongest correlation to contract value seems to be total WAR already accumulated. Thus the old adage about teams paying for past performance.. Ohtani doesn’t quite fit, but probably not outlandishly so for being the only two-way player in this group.
The second tier of players falls within the $7m – $8m per WAR range. These guys all project to average 2.2 – 3.2 WAR for the duration of their contracts. They also have notably lower career OPS than top tier hitters, pretty much in the high .700’s instead of .950-ish. Based on the numbers, I suspect the Orioles have a slightly more bullish projection on O’Neill.
Santander stands out as an oddball. One player doesn’t make a third tier, but he is below $6m/yr/WAR (projected). He is at the lower end of OPS and his career WAR has not crossed 10 yet, so suspecting he gets discounted a bit for that. And perhaps Zips projection is too bullish for him.
Guerrero’s contract looks like a bit of a steal for the Blue Jays, although I question the length. They are getting all his prime years and he really fits above the middle tier but just below the elite tier of Ohtani, Bregman, Soto. $7.5m (NPV) per projected WAR looks like a pretty good deal, as they are paying Tier 2 rates for a player who projects above that tier.
It is difficult to discern the more exotic elements of these contracts. As with pitchers, we see a couple of twists. One, deferred money is getting bigger and pushing contract dollars to the back-end. One player (Bregman, I think) gets his last payment 22 years from now. Two, large bonuses put decent outlays at the very front end, creating an inverted curve aspect to the $ per WAR cost a team pays each year. I can’t quite make what to think of this. There must be some strategic benefit to pushing costs to either the very front-end or the very back-end of contracts that I can’t quite yet discern. More on that in a later article.
One explanation I can come up with is the teams with the most capital can play at both ends of the contract in ways the remaining teams can’t, effectively eliminating most of the competition for said players services. The Mets have the capital to pay Soto a $75,000,000 signing bonus plus his first-year salary (bringing his first year pay out to $121m). Can you picture a team like the Cardinals dropping that kind of coin on a player before they’ve played a game with them? The Mets, in 2025, will put out almost as many $$ towards Juan Soto than the Cardinals will their entire payroll. Wow. But in the long run, that per WAR contract commitment really isn’t much different than Goldy or Arenado. Just structured in a way the Cardinals (and other teams) shy away from. More on this topic next week.
One oddball in the data I see is Bregman. He has a very short contract, which appears to be driven by his age (31). His career OPS is a cut below Soto/Ohtani, but well above Tier 2. Career WAR is in line with Ohtani and Soto. Even with significant deferrals, his per WAR contract value comes out as top tier at $9.5m per projected WAR. I’m going to hazard a guess that the Red Sox have a much rosier picture of his future projection than Zips or OOPSY does. His recent trends aren’t a cause for optimism. But they are more optimistic than his primary competition, which was Nolan Arenado’s contract, so I wonder if the Red Sox chose to pay the non-linear premium on Bregman for the last incremental bit of production (4 WAR instead of 3). Or perhaps in another view, chose Bregman’s $/WAR over Arenado’s $/WAR after factoring in what the Cardinals were willing to contribute.
Overall – the takeaways (or Rules of Thumb)
Contract length is driven primarily by age.
Much like pitchers, I see a floor both in the contract data and performance data of about 1.0-1.5 WAR, suggesting an older hitter who isn’t expected to hit that floor is going to be replaced by a league-minimum player or one making a few million in their arb-eligible years. In essence a 1 WAR hitter has a market rate of ~$1m, not $8m.
It’s also not clear that rates have markedly changed over longer periods than just the last two years and with a larger sample. There may be too few sample points to draw too much conclusion yet. But as I compare these contracts to older ones on a sample basis, they look remarkably similar.
Since this is a Cardinal blog, I’ll throw in a couple of other observations:
- If the Contreras to first base move works out even passably, the Cardinals contract with him may turn into a nice bargain. 3 WAR production (with some potential upside) for $18m a year looks pretty good against the spreadsheet above, no?
- Arenado will be paid (by STL) at $27m for what is projected to be 3 WAR. A bit high, but in the range. Following the decline curve data, his contract will be much more in line in 2026 and 2027. This suggests to me his contract may be more moveable at the end of this year, provided his baseline performance holds up. They will have to play him for this to occur (a note to those that advocate for benching him and playing Gorman at third).
- Given some of these numbers, there might be a basis to discuss contract extensions for Nootbar and Donovan soon.
- When I look at these player values, I think of Ivan Herrera and his .800 OPS season in 2024. He might be my pick for “surplus value player of the year” for the Cardinals.
Authors note: This was written before Opening Day, so it’s not euphoria based on IH’s hat trick on April 2. Based on early returns, I think I’ll stay with this pick, though.
As stated, I recognize the small sample size factor here, so can’t put too many stakes too deep in the ground on this one. But this market is by definition all small samples, so we get to parse the data we have.
Seems like lots of noise recently about Kyle Tucker and his impending Free Agency. On the surface, I’d say that FA contracts are heavily influenced by how many big spending teams play in the market. It’s not clear to me how may big spenders will be in the bidding for Tucker (I don’t include the Cubs in that group). Dodgers and Yanks seem unlikely, as do the Padres. Red Sox not as likely, but he’d fit there. Giants, maybe? Braves could use his services, but is he their style? If I had to speculate, I’d say Tucker, at age 29, is looking to land in the area of 8-10 years and AAV dollars in the area of V. Guerrero (closest OPS and WAR comp) so maybe $400m AAV (without discounting). Go up from there if some big players get involved.
Next week, I will go a step further in this and deep dive into Tommy Edman’s contract extension. I recognize he wasn’t an FA, but his contract has similar characteristics, along with some notable differences. He also is a hometown interest, so I thought we’d look at him a bit closer. I’m also consulting with a financial analyst to better develop some theories about the front- and back-loading of these contracts and what the advantage to that strategy might be.
Until then, discuss.